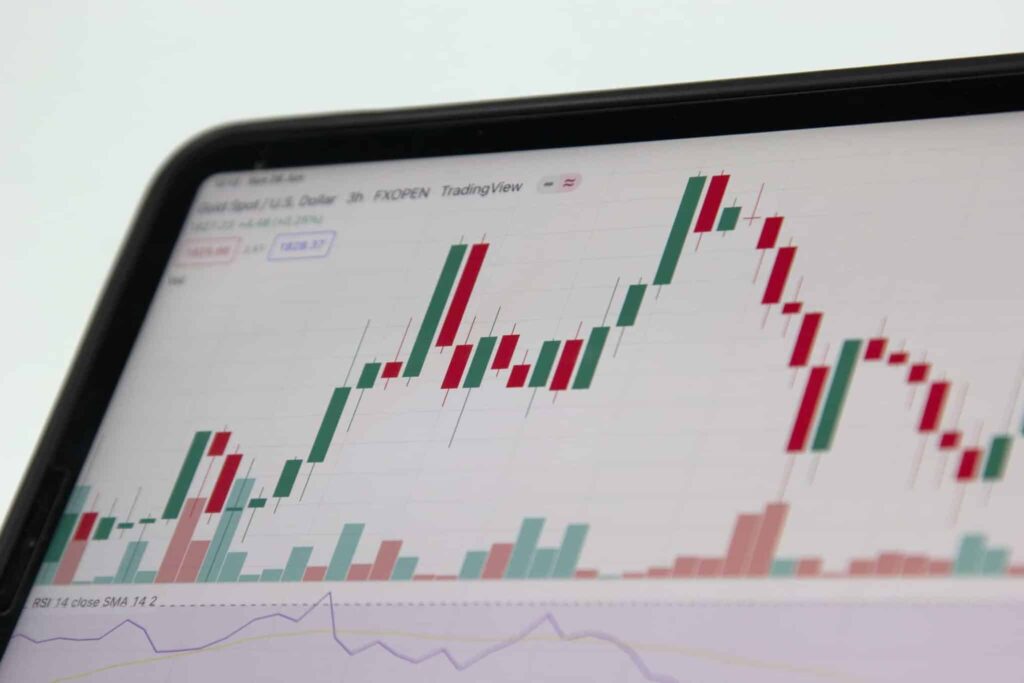
How to Spot Institutional Footprints in Forex Trading Charts

Many retail traders enter the world of Forex trading believing that price movements are purely based on supply and demand. However, beneath the surface, institutional players—such as banks, hedge funds, and liquidity providers—are shaping the market in ways that most retail traders fail to recognize. These big players leave behind clues in price action, volume, and liquidity, known as “institutional footprints.” Understanding how to spot these footprints on your trading charts can provide a significant edge, helping you avoid traps and align your trades with the market’s real movers.
Why Institutional Footprints Matter in Forex Trading
Institutional traders control a vast portion of the forex market, executing massive orders that can influence price movements. Unlike retail traders, they don’t place a single large order at once, as that would cause immediate spikes in price. Instead, they distribute their orders strategically, often using advanced execution algorithms to stay under the radar. However, these hidden maneuvers still leave behind subtle signals that skilled traders can identify and use to their advantage.
Key Institutional Footprints on Forex Charts
1. Liquidity Zones and Stop Hunts
One of the most telling signs of institutional activity is liquidity hunts. Institutions need liquidity to execute large trades efficiently, so they often drive price towards areas where retail traders have placed stop-loss orders. These liquidity zones are typically found at:
- Swing highs and swing lows
- Key support and resistance levels
- Psychological price points (e.g., 1.2000, 1.5000 on EUR/USD)
When you see price rapidly breaking a key level only to reverse sharply, it’s often a liquidity grab engineered by institutions. Instead of reacting emotionally, wait for confirmation that the move was a stop hunt before entering a trade.
2. The Order Block Phenomenon
Institutions often use order blocks, which are clusters of orders left behind after a significant price move. These zones serve as strong support or resistance levels, as institutional traders often return to these price points to complete their positions.
To identify an order block:
- Look for a strong bullish or bearish move followed by a small consolidation area.
- Mark the last bullish candle before a sharp downtrend or the last bearish candle before a strong uptrend.
- Expect price to revisit these areas before continuing its trend.
Recognizing order blocks can help traders enter positions at the same levels as institutional players, improving trade accuracy.
3. Imbalance and Fair Value Gaps
When large institutions place bulk orders, they often leave behind imbalances, or “fair value gaps,” where price moves aggressively in one direction with little resistance. These gaps appear as large-bodied candles with minimal wicks, indicating a lack of opposing orders.
Retail traders can use these imbalances in Forex trading as potential areas where price may return to fill gaps before continuing in its original direction. Watching for price reactions at these levels can signal institutional re-entry.
4. Volume and Market Profile Clues
While the forex market doesn’t provide centralized volume data, traders can still analyze tick volume and market profiles for clues about institutional activity. High tick volume during key price movements often indicates that big players are involved, reinforcing trend direction.
Another useful tool is Volume Profile, which shows price levels where the most trading activity has occurred. Institutional traders often accumulate positions at these high-volume areas, making them significant support and resistance zones.
5. Fake Breakouts and Reversals
A common institutional tactic in Forex trading is creating false breakouts to mislead retail traders. Many traders enter positions when price breaks a key level, only to see it reverse sharply against them. Institutions exploit this behavior by triggering breakouts, absorbing retail orders, and then pushing the price in the opposite direction.
To avoid getting caught:
- Wait for confirmation after a breakout, such as a retest of the broken level.
- Observe candle wicks—long wicks at key levels often indicate institutional stop hunts.
- Use multi-timeframe analysis to verify the breakout’s legitimacy.
Understanding institutional footprints in Forex trading can dramatically improve your ability to predict market movements and avoid being manipulated by large players. By recognizing liquidity hunts, order blocks, imbalances, and fake breakouts, traders can position themselves more strategically and trade with the flow of the market rather than against it.


